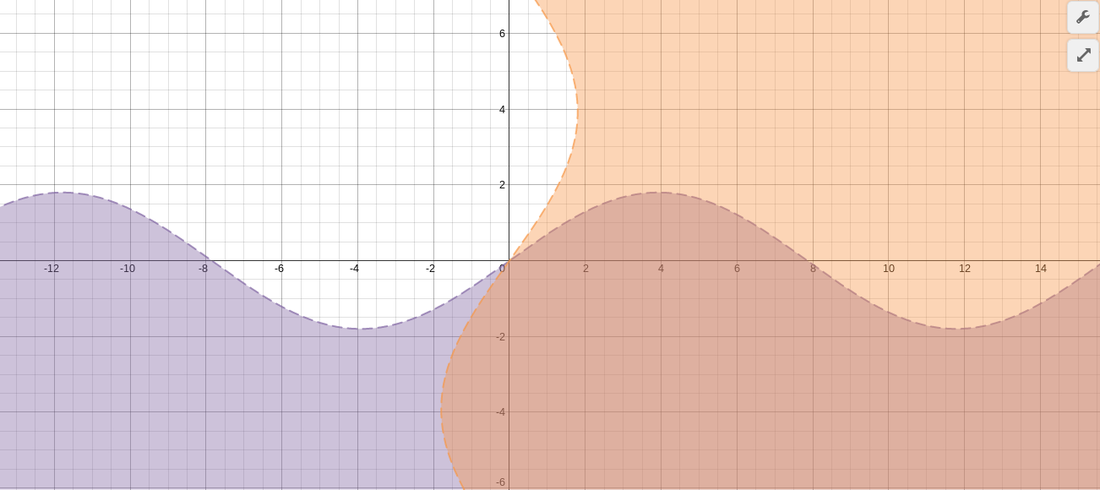
The equations that I used to create this picture is x>sin(y) and y<sin(x). The sin in each graph gives it that wave shape, and the < an > make it so the graph is shaded. The second function is an inverse of the first. The sin(y) makes this first function along the y-axis and the sin(x) puts it along the x-axis.
 RSS Feed