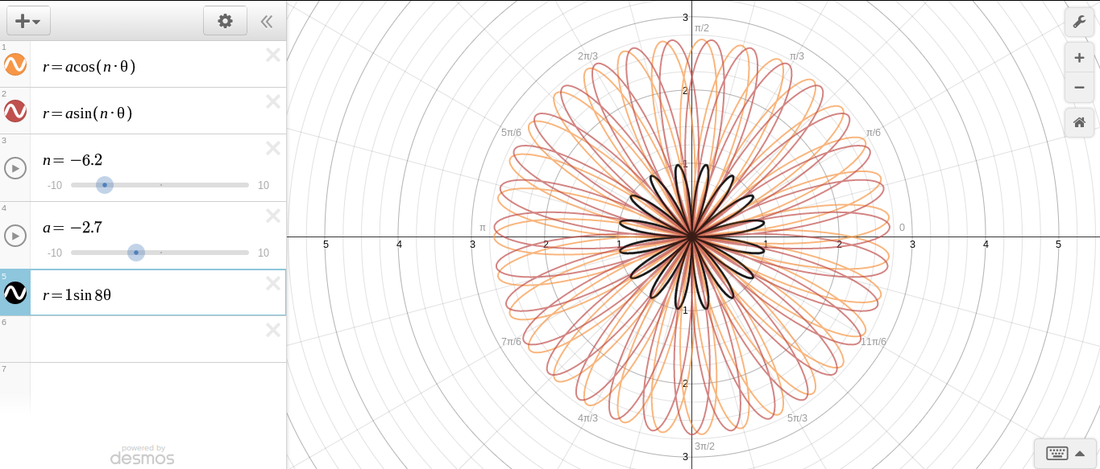
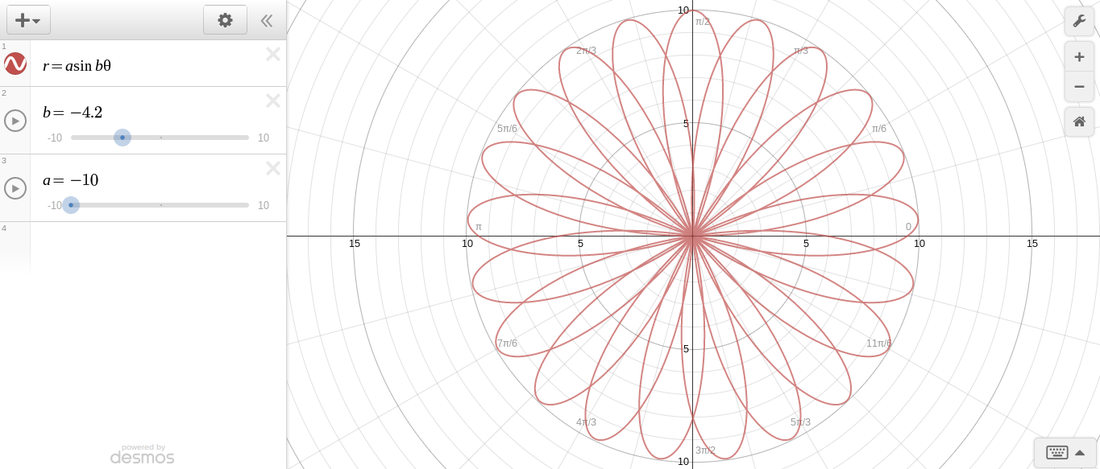
The bottom picture is one of the original roses that were created, and the top one is the one I created on my own in desmos. For the top picture, the slider a made the lines larger, and the slider b changed the position of the lines. For example, they could all be clumped together, or separated like I have. By putting a number in front of theta, it changed how many "petals" that the rose had. The same went for the bottom graph. slider a made the petals larger, and slider b changed how clumped together or spread apart they were.
float sinVal; int toneVal; int k=0; void setup() { pinMode(8,OUTPUT); } void loop() { while(k<2000){ for (int x=0; x<360;x++) { // convert degrees to radians that obtain sin value sinVal = (1*sin(x*(3.1412/360))); // generate a frequency from the sin value toneVal = 200+(int(sinVal*1000)); tone(8, toneVal); k++; delay(10); }} for (int x=0;x<180;x++) { //convert degrees to radians then obtain sin value sinVal = (.5*sin(x*(3.1412/360))); // generate a frequency from the sin value toneVal = 500+(int(sinVal*750)); tone(8, toneVal); delay(.5);} } https://drive.google.com/a/giresdschools.net/file/d/0B4EfYsrjIbp_emFvVk5kNUxYaTIzYjlnd21oNGRBSHM0cjNJ/view?usp=sharing To make the tone change, we changed the amplitude to 0.5. We also changed the delay to 0.5, which made the tone repeat itself rapidly and the amplitude changed the sound.
In these graphs, the asymptotes on the graph tan(x) are always when cos=0. The same thing goes for cot, whenever sin=0 there is an asymptote. On the graph for sec, there is asymptote whenever cos=0. For csc, whenever sin=0 then there is an asymptote. The period for the graphs of sine and cosine are both 2pi. The amplitude for sine and cosine are both 1. Both sine and cosine have amplitudes of 1 and periods of 2pi. However, cosine and sine start and end at different points on the graph.
On these unit circles there are degrees on the circle labeled with their coordinates. On the top picture, the numbers labeled on the inside of the circle are the radians. For example, if you look at 30 degrees the sin would be the y coordinate, so it would be 1/2. The cos for this would be the x coordinate, so it would be the square root of 3 over 2. The tan of these is sin over cos, so that would be 1/2 divided by the square root of 3 over 2.
Government subsidized and unsubsidized loans are different from each other. The federal government pays the interest on subsidized loans during periods of authorized deferment. Bank loans are loans made by a lender. Private loans you pay while you're in school and federal loans you pay once you graduate, and the government pays while you are still in college. The government interest for loans for undergrads are 4.66% and the the interest for private loans are 6.39% (Wells Fargo). To calculate how much you would pay over time, we used the equation A=P(1+r)^t. So if we took out a $20,000 loan ($5,000 each year of college), we would use the equation A=20,000(1+0.0466)^15 (we got the 0.0466 from the interest rate of the government loan and the 15 from an estimated amount of years) and it came out to be $220 a month. We did it again for 20 years and got $207 a month, and again for 10 years and got $262 a month. Now what happens when you borrow $100,000? well the equation would be 100,000(1+0.0466)^20. This comes out to be $1,036 a month. That's crazy! I'm definitely going to be looking more into these things as I get closer to applying for colleges.
To reach to moon, you must fold a piece of paper in half 42 times. This is impractical because you would have to deconstruct the paper fibers into their atomic form for it to reach the moon. However, if you did deconstruct the paper fibers, you could then theoretically fold a paper enough times to reach the moon. Is that still considered paper at that point? I think not.
Limits show you the value that a function approaches as the input approaches a value. A limit exists when when both sides approach the same value. The same thing goes when using limits with discontinuity. It tells you what the left side of the graph is approaching, and it tells you what the right side of the graph is approaching.
If you know the factors for the polynomial, you set them equal to zero and solve for x. Division helps find the zeros that aren't easily found on the graph.The degree of the polynomial helps determine the number of zeros because if it is x⁴ for example, then there will be four zeros. This also determines the number of factors because the prime factors for x⁴ are x*x*x*x, so there have to be at least four factors to be able to get to x⁴.
The equations that I used to create this picture is x>sin(y) and y<sin(x). The sin in each graph gives it that wave shape, and the < an > make it so the graph is shaded. The second function is an inverse of the first. The sin(y) makes this first function along the y-axis and the sin(x) puts it along the x-axis.
|